1

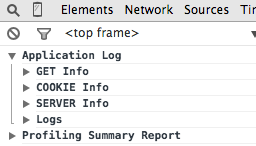
Im only recently noticed that sites with devMode turned on add some helpful information about queries and other logs into the console.

See this screenshot:
-11-09%2018.55.38.png

but im also noticing that some of our sites that also have devMode turned on locally arent showing the console log information? I cant seem to figure out what else needs to be on to get this output to show up?

related to this is there anyway to add more grouping to the "logs" group to mirror the exiting log folder (ie. give plugins their own group of logs)

Any ideas?

1 Answer 1

2

Craft 3

You can enable debugging information by going to your user's account preferences and turning on the "Debug Toolbar" for all control panel requests, front-end requests, or both. That will place a nice GUI toolbar across the bottom of the web page so you don't have to view the browser's console to see the output like you did in Craft 2.

Craft 2

All that's required for the logging and profiling information to show up in the browser's console is that devMode is enabled.

If it's not showing up then, then either you're enabling it in the wrong place in a multi-environment config or you've got a plugin that's explicitly removing the logging routes.

2
  • Is this still true? I've set devMode in my general config file (one environment, nothing special) and disabled all plugins, but still don't see any information in the browser's console.
    – Mitchell
    Commented Jan 5, 2022 at 10:40
  • 1
    Updated the answer @Mitchell
    – Brad Bell
    Commented Jan 5, 2022 at 23:52

Your Answer

By clicking “Post Your Answer”, you agree to our terms of service and acknowledge you have read our privacy policy.

Not the answer you're looking for? Browse other questions tagged or ask your own question.